Data Visualization
Advertisement
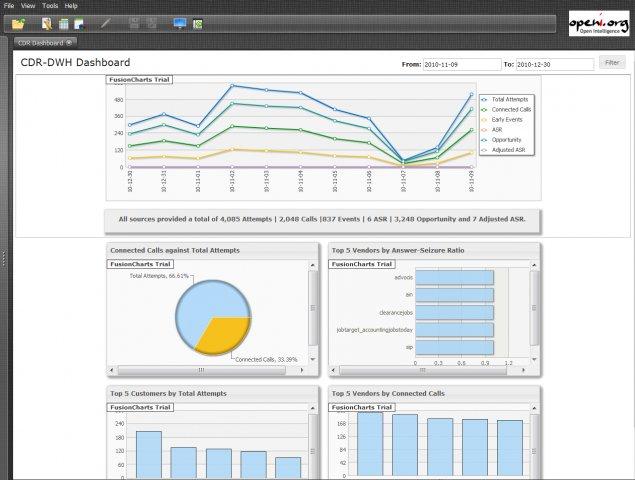
StatPlanet v.2 3
StatPlanet is a browser-based interactive data visualization and mapping application. Use it to easily and rapidly create visualizations from simple Flash maps to advanced infographics. StatPlanet can be freely and easily hosted on your own website.
Advertisement
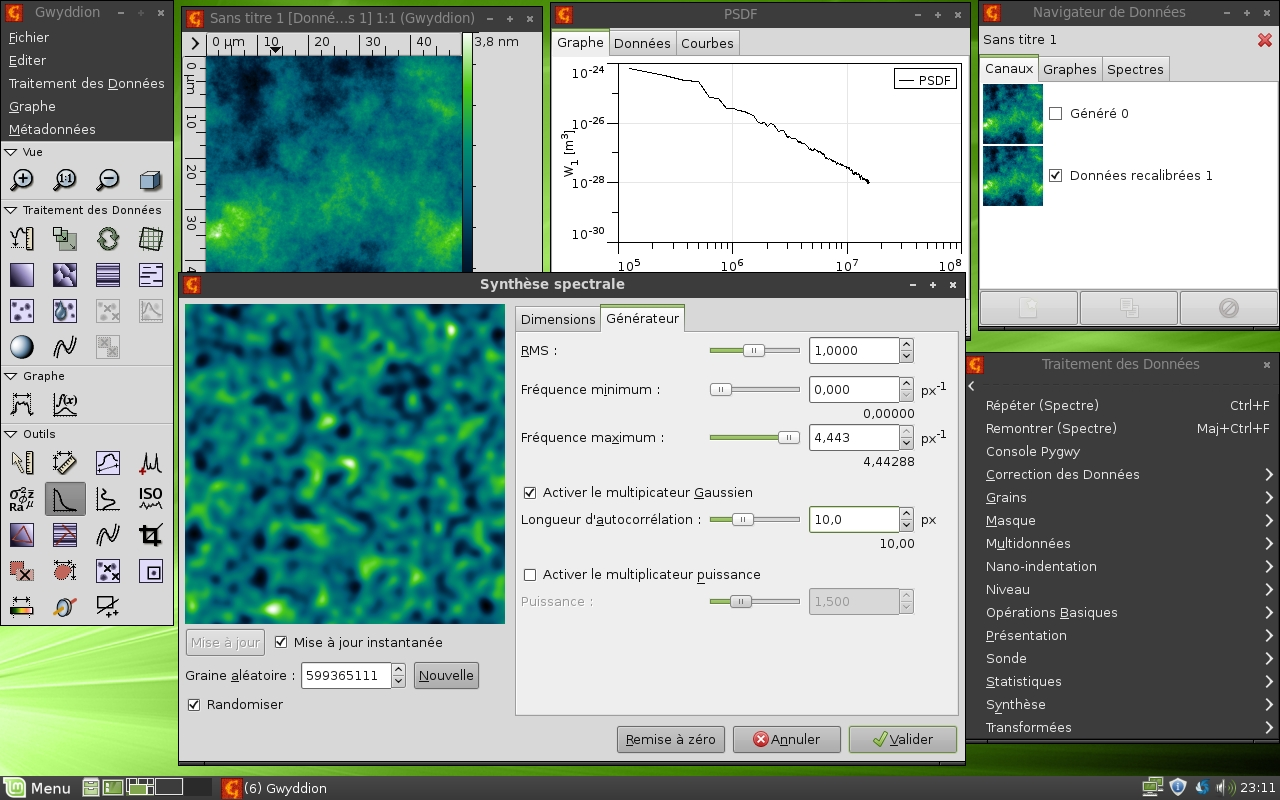
Gwyddion v.2.23
Gwyddion is a modular program for SPM (scanning probe microscopy) data visualization and analysis.
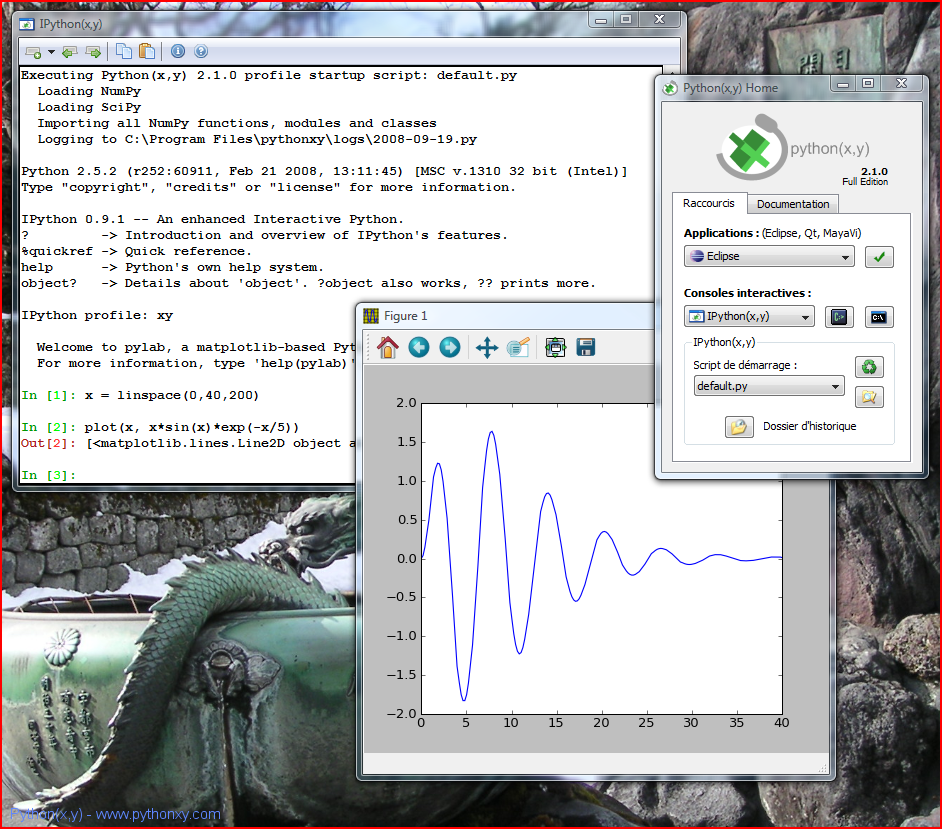
Python(x,y) v.2.7.3.1
Python(x,y) is a free scientific and engineering development software for numerical computations, data analysis and data visualization based on Python programming language, Qt graphical user interfaces and Spyder interactive scientific development en
Tuning Fork Visualization Platform v.2.0.0
Tuning Fork Visualization Platform is a data visualization and analysis tool built on the Eclipse Rich Client Platform that supports the development and continuous monitoring of systems.
Integrated Genome Browser v.6.7.1 Build 10851
GenoViz provides program applications and re-usable components for genomics data visualization and data sharing. One included project is IGB: the Integrated Genome Browser. View genome annotations with this tool.The Integrated Genome Browser (IGB,
JSON Viewer v.1.19v
JSON Viewer is a JSON parser for data structure visualization.JSON Viewer Features: 1. Can handle huge amounts of data 2. Fast 3. Unicode ready 4. Data visualization both in treeview and grid 5. Powerful filtering abilities 6. Multi language (En and
Koolon v.0.0.0.3
Yet another graph modeling application. Koolon is a simple graph (network) modeling tool with interactive data visualization like Prefuse. It allow to create entities, relations, ontologies,
Mondrian v.1.2
Mondrian is a general purpose statistical data-visualization system, features excellent interactive visualization techniques for data of almost any kind, and has the capability to work with Categorical Data, Geographical Data and LARGE Data. All
VStar v.2.13 Revision 907
Star data visualization made easy. VStar is a statistical analysis tool for variable star observation data developed for the American Association of Variable Star Observers (www.aavso.org/) and the Citizen Sky project (www.citizensky.org/).
Rlab for Linux v.2.10.5
Rlab is an interactive, interpreted scientific programming environment.
Rlab for Windows v.2.10.5
Rlab is an interactive, interpreted scientific programming environment.